
Contents
Chapter 3. Getting Started
A quick tour of the dashboard, bringing in what you already have in Paddle, how to test safely, and a first product on sale in a few minutes.
A Tour of the Dashboard
Go to → . The PaddleSubs Dashboard opens with three panels:
- The menu of PaddleSubs pages
-
Links to Products, Categories, Levels, Discounts, Transactions, Access Subscriptions, Licenses and Import. A beside some of them adds a new one straight away.
- Sales Graphs
-
Sales over time and sales by product, for the dates you choose (the last 30 days to start with).
- Statistics
-
Sales and earnings today, this month, this year and last year, and how many customers and Access Subscriptions are active right now.
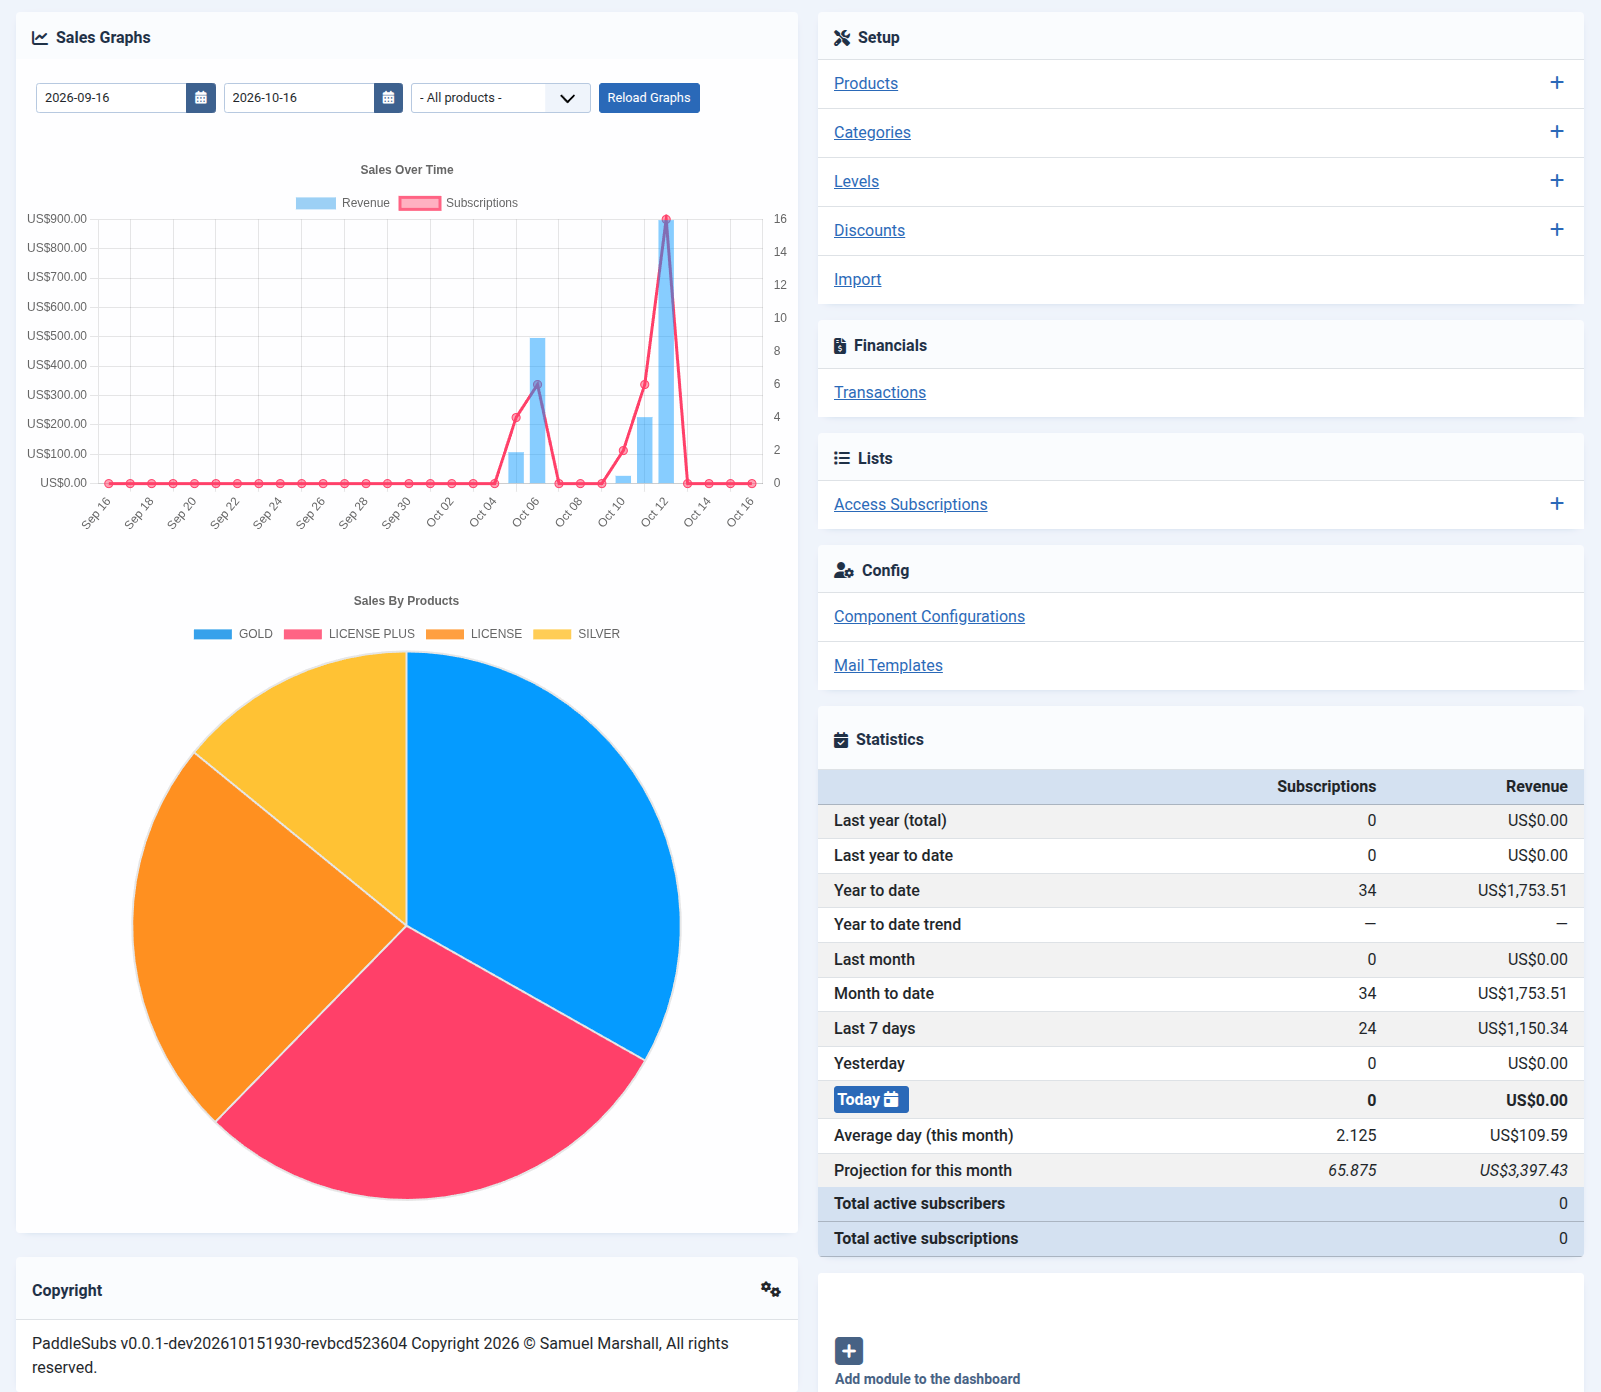
Sales figures come from Paddle and are what Paddle pays you, after its fee and any refunds, in your Paddle payout currency. the section called “The Dashboard” explains every number.